What the node measures
Every few minutes the node runs small probes: ICMP, TCP, DNS and HTTP to baseline targets and to other Sensmos nodes — real homes on real connections in other countries. Five packets per probe; you get RTT, jitter and loss. Where possible nodes also hole-punch directly to each other and run traceroutes when a path dies.
Nothing about your traffic is observed — only these probes.
The outage log ("Connection report")
The firmware keeps a log of link episodes:
- when the connection dropped and came back, to the second;
- whether the router was reachable during the outage (your Wi-Fi vs. the provider);
- whether the node rebooted in the meantime.
In the app, add the Connection report plugin on the node card: it shows the history and has a Copy report button — a plain-text list you can paste into a complaint to your provider.
The map
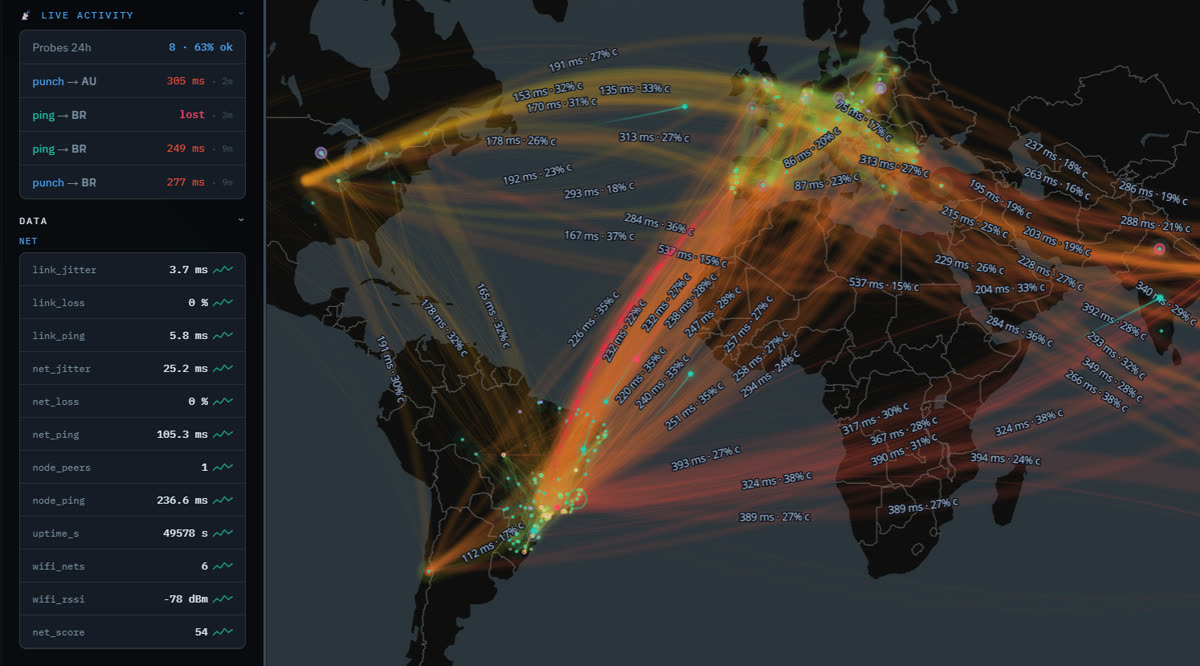
The live map shows what the whole network sees: arcs of real probes between homes, per-region latency bands, incidents and anomalies as they happen, and a per-provider ranking by country. If your neighbours on the same ISP are red at the same time, it was not your Wi-Fi.
Check-now
From the map you can ask the network to fetch any domain right now — from real home connections in several countries — and see the results on the map. Handy for "is this site down for everyone or just for me".
Provider rankings
The same probes feed a public ranking of providers per country on upfromwhere.com/isp — measured from homes on this fleet, not from a data centre. Nothing to sign up for; it is a read-only view of what the network sees.
Price
Free. This is the node's basic job; it is how the network earns its keep.